A/B Testing Conversion Funnels
One of the most common metrics companies track is conversion funnels. For example, a shoe company might track what % of people who land on their home page buys shoes. Similarly a SAAS company might track what percentage of free trial users convert to paid users.
In this tutorial I'm going to walk you through how to build conversion funnels in GraphJSON. We will then take it one step further, showing how we could go about running A/B tests to optimize these funnels.
In this tutorial, let's say we are a SAAS company and we want to track the landing page -> sign up page -> signed in page conversion.
Step 1 - Create the collection
The first step is to create a collection where we will log our data to. Collections are a really handy way to organize your data. Simply navigate to https://www.graphjson.com/dashboard/collections and click the "New Collection" button on the top right.
In this example, I named the collection "experiments".
Step 2 - Log the data
Let's create a logging module so we can have cleaner code when logging. The module I create looks as follows:
export function log(json) {
  const payload = {
    api_key: process.env.api_key,
    timestamp: Math.floor(new Date().getTime() / 1000),
    collection: "experiments",
    json: JSON.stringify(json)
  };

  await fetch("https://api.graphjson.com/api/log", {
    method: "POST",
    headers: { "Content-Type": "application/json" },
    body: JSON.stringify(payload)
  });
}
Now to finish logging, we simply insert the following code where the events we care about happen.
import { log } from "@/lib/log";

function getIPAddress() {
  // Something like https://stackoverflow.com/questions/3653065/get-local-ip-address-in-node-js
}

export function loadLandingPage() {
  // ... Code to load landing page
  log({
    event: "load_landing_page",
    ip: getIPAddress(),
  });
}

export function loadSignUpPage() {
  // ... Code to load sign up page
  log({
    event: "load_sign_up_page",
    ip: getIPAddress(),
  });
}

export function loadSignedInPage() {
  // ... Code to load signed in page
  log({ event: "load_signed_in_page",
    ip: getIPAddress(),
  });
}
You'll notice that we log the IP address in addition to the event. This allows us to easily de-duplicate users to have a more accurate funnel.
Step 3 - Visualize the data
After adding the logging, we should be able to see the data via the query tool. Let's make a new query. Go to https://www.graphjson.com/dashboard/queries and click on "New Query" at the top right corner.
We can run a really simple query to begin to see if we have the data. For instance we can inspect the data in our "experiments" collection with the following query:
SELECT
    *
FROM
    experiments
LIMIT
    10
After running that query you should see the JSON blobs you've logged. Now let's proceed with the funnel analysis. To do that we'll run the following query:
SELECT
  COUNT(DISTINCT JSONExtractString(json, 'ip')) as count,
  JSONExtractString(json, 'event') as event
FROM
  experiments
WHERE
  toDateTime(timestamp, 'America/Los_Angeles') > subtractMonths(today(), 1)
GROUP BY
  event
ORDER BY
  count DESC
LIMIT
  100
That's a lot! Let's break it down:
JSONExtractString(json, 'event') as event
Simply extracts the event field from our JSON blobs and assigns it to alias "event".
COUNT(DISTINCT JSONExtractString(json, 'ip')) as count,
Simply de-duplicates events so that no IP address will be counted more than once. For instance if a user refreshes the page 10 times, it will only count once.
toDateTime(timestamp, 'America/Los_Angeles') > subtractMonths(today(), 1)
Narrows the down the data to only events logged for the past month.
GROUP BY
  event
Groups the counts by event type.
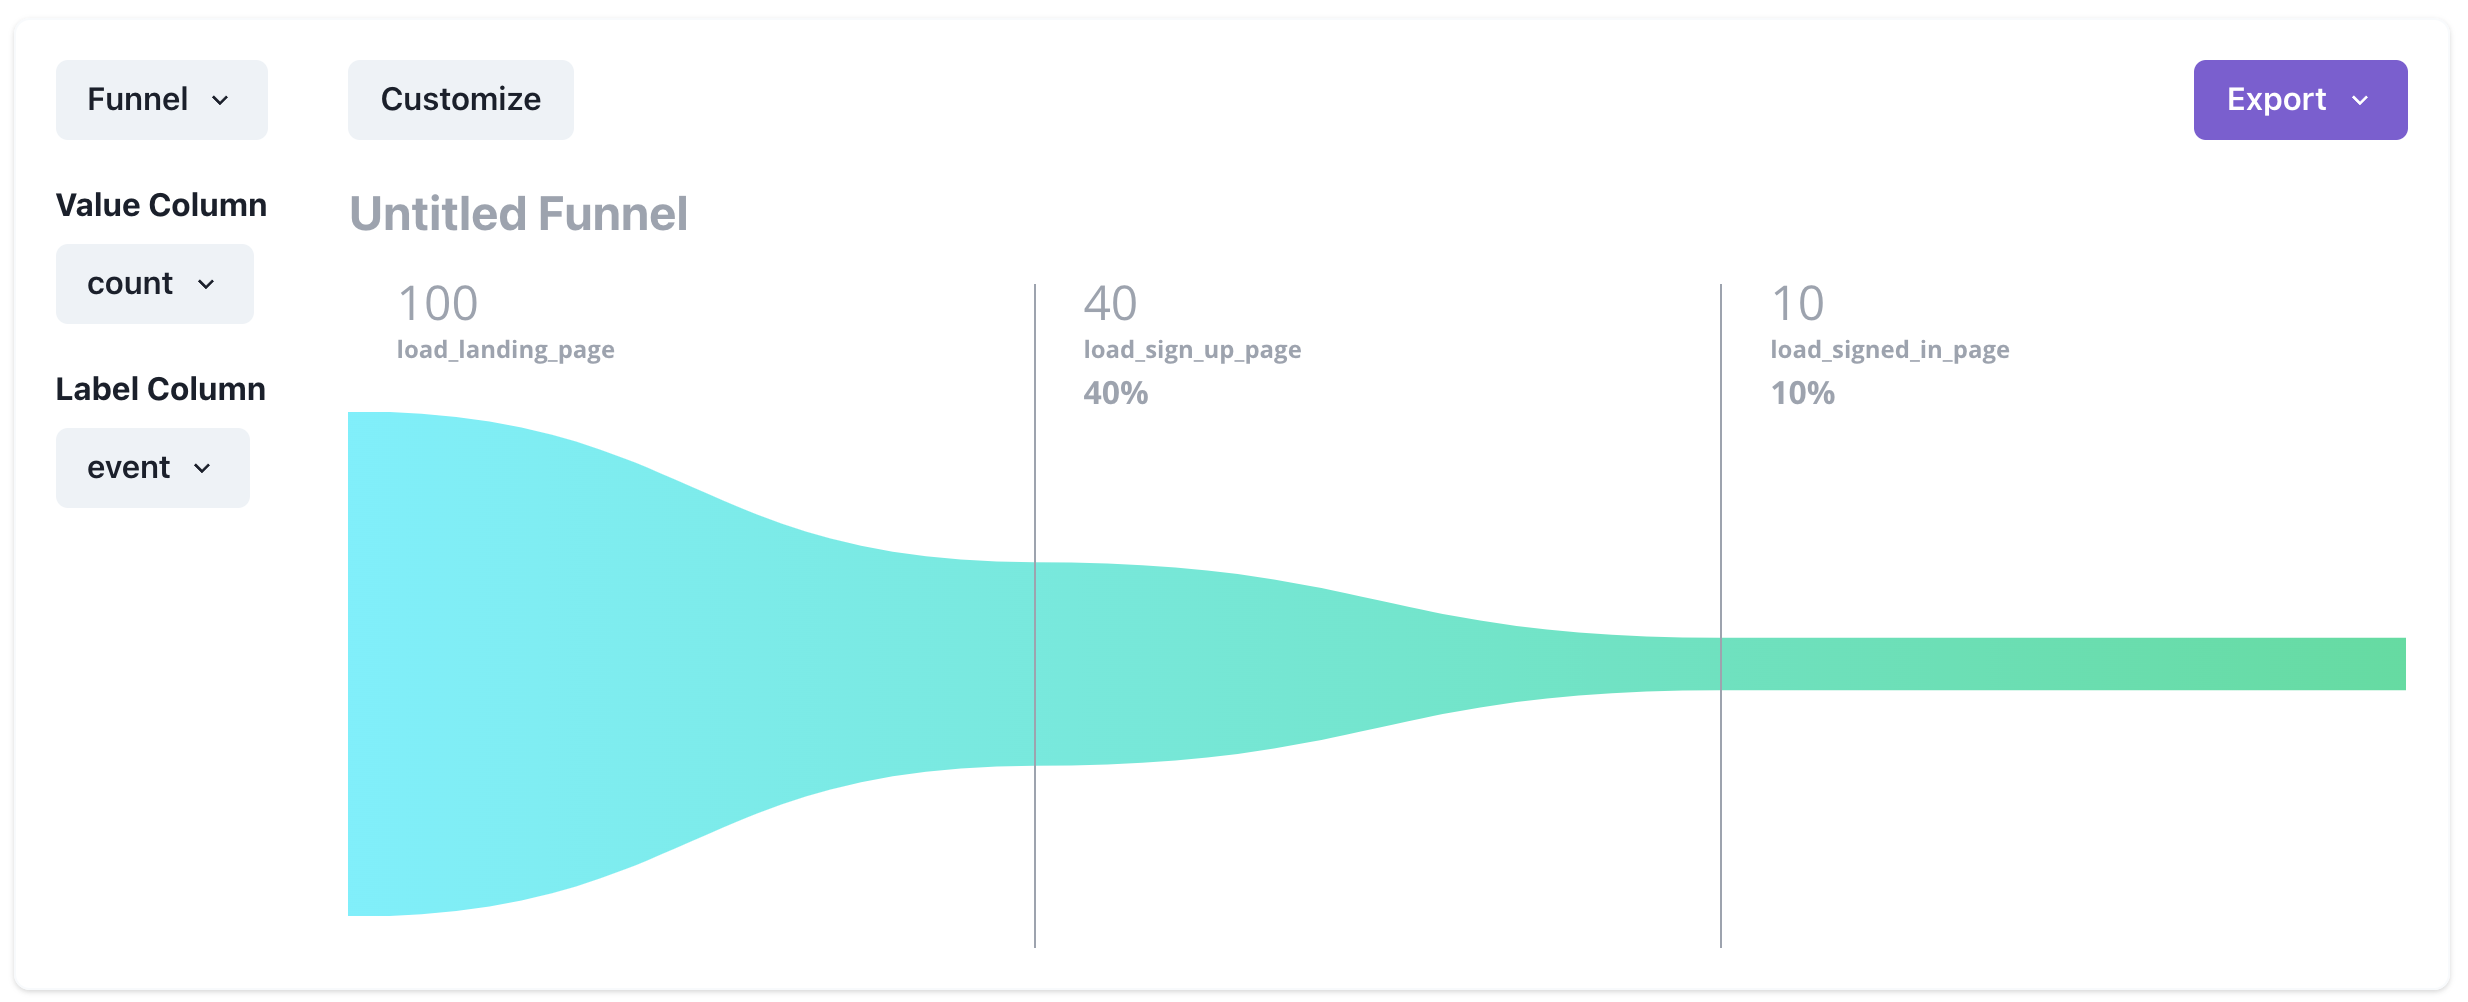
So after running the query, we should get a table that looks something like:
| event | count |
|---|---|
| load_landing_page | 100 |
| load_sign_up_page | 20 |
| load_signed_in_page | 5 |
If we click on the Visualization tab. We can graph the funnel by using "event" as the label and "count" as the value.
Step 4 - A/B Testing
We're on the final step! Let's now run an A/B test. We'll test to see if changing the home page color scheme to dark mode improves conversions. All we need to do is add one additional field to our logging:
function hashCode(str) {
  return str.split('').reduce((prevHash, currVal) =>
    (((prevHash << 5) - prevHash) + currVal.charCodeAt(0))|0, 0);
}

function isDarkMode(ipAddress) {
  return hashCode(ipAddress) % 2 === 0;
}

export function loadLandingPage() {
  // ... Code to load landing page
  log({
    event: "load_landing_page",
    ip: getIPAddress(),
    is_dark_mode: isDarkMode(getIPAddress()),
  });
}
The code above randomly assigns whether or not a user gets dark mode based on their IP address.
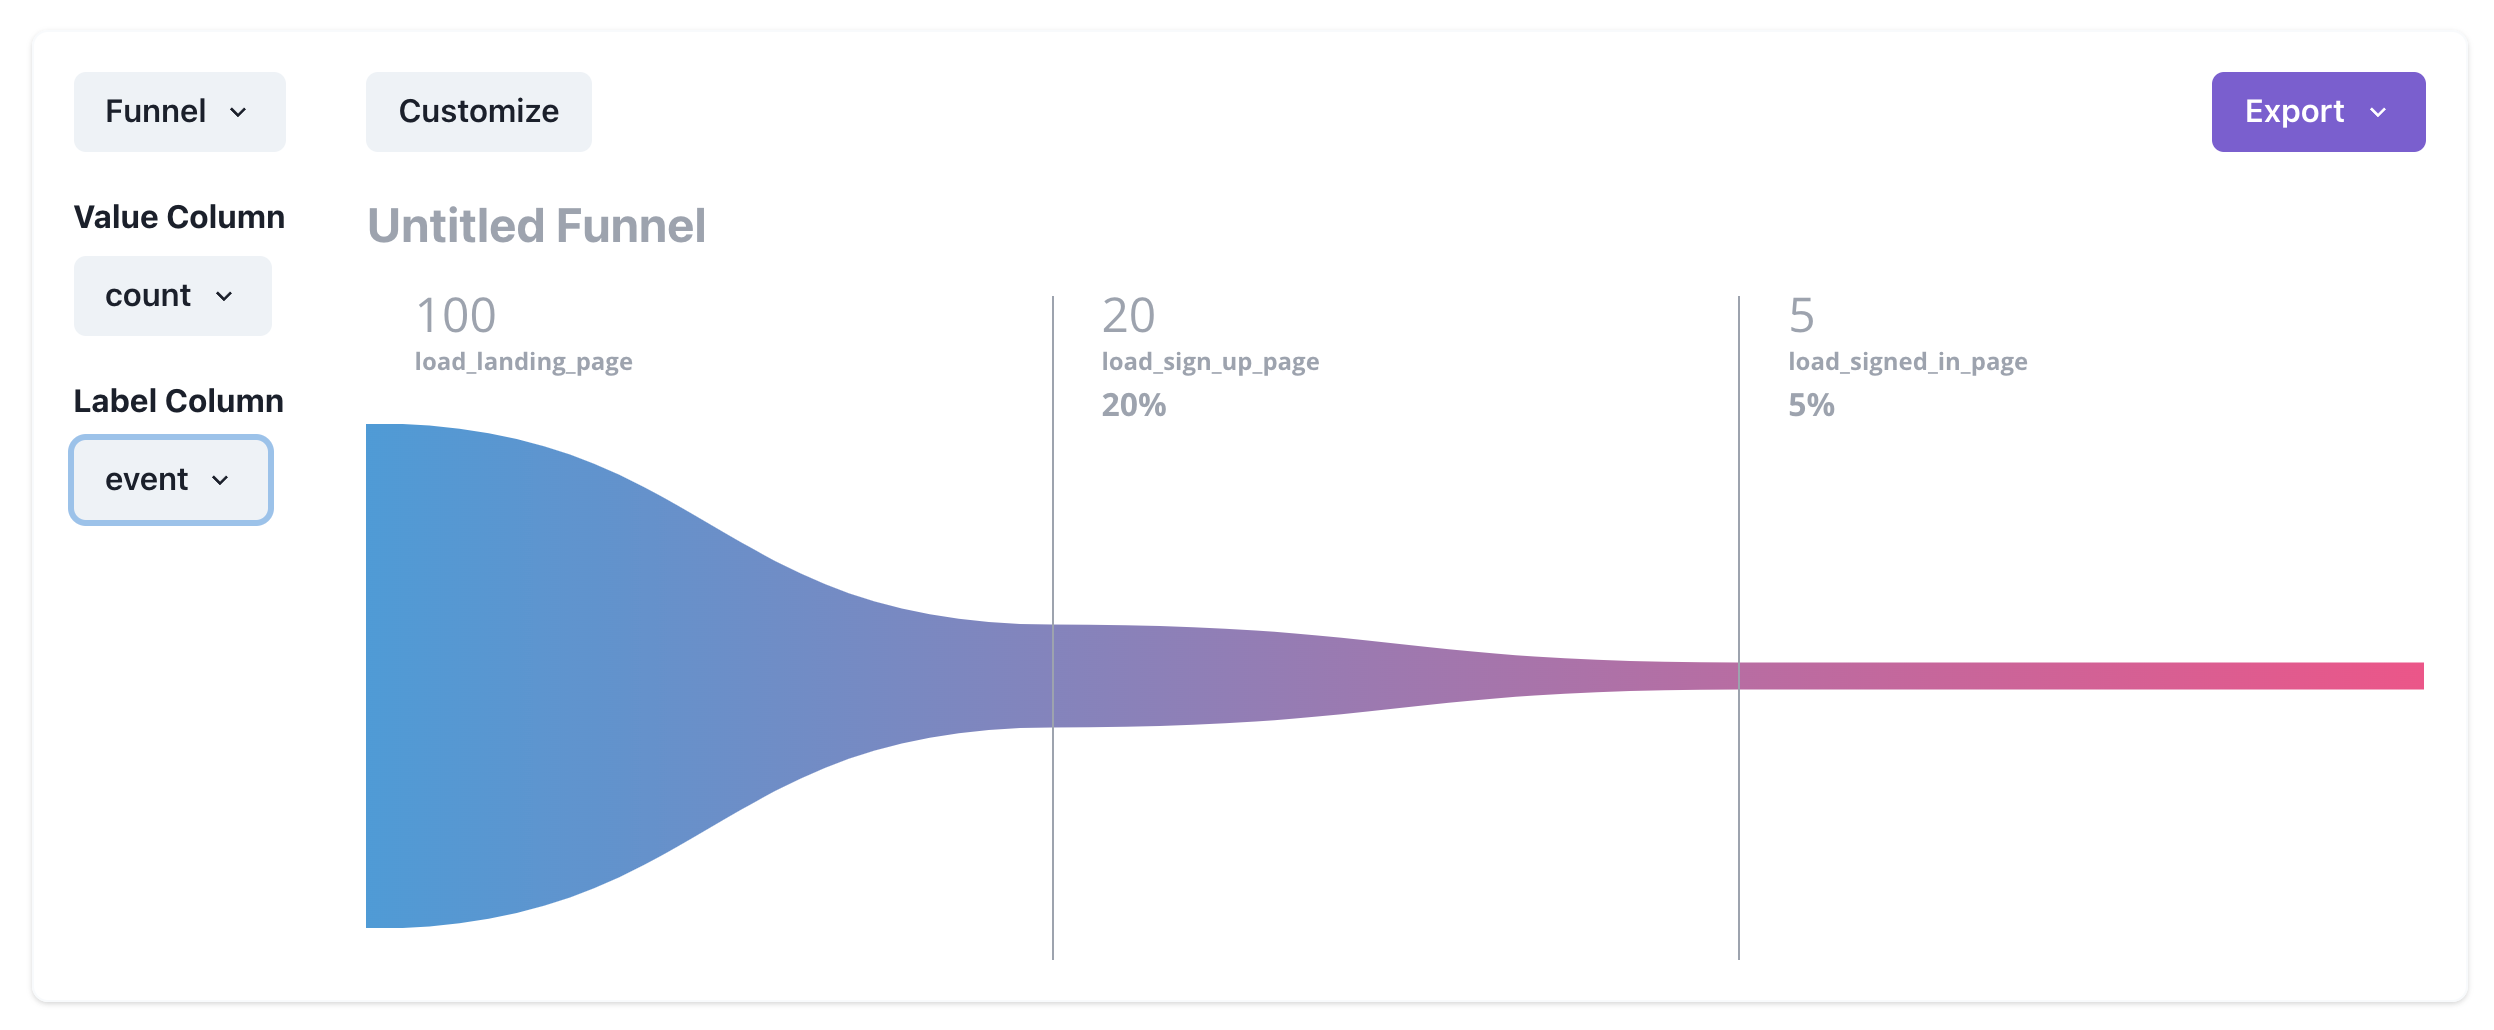
We can now run a query to see if the adding dark mode changes conversions using the following adapted query:
SELECT
  COUNT(DISTINCT JSONExtractString(json, 'ip_address')) as count,
  JSONExtractString(json, 'event') as event
FROM
  experiments
WHERE
  toDateTime(timestamp, 'America/Los_Angeles') > subtractMonths(today(), 1) AND
  JSONExtractBool(json, 'is_dark_mode') = 1
GROUP BY
  event
ORDER BY
  count DESC
LIMIT
  100
Notice the JSONExtractBool(json, 'is_dark_mode') = 1, which filters all events for those that have dark mode. And bam! We see indeed dark mode does double the conversion rate!