Personalized user dashboards
With GraphJSON you can dynamically create graphs with whatever filters you want at any time you want.
A perfect application of this capability is user dashboards. For example, Uber could show each driver a unique dashboard with graphs showing how many rides they've done, how much money they've earned, etc.
For this guide, I'll show you how create dynamic user dashboards with GraphJSON. As a concrete example we'll be building a user analytics dashboard for sellers on my other side project Flurly
Goals
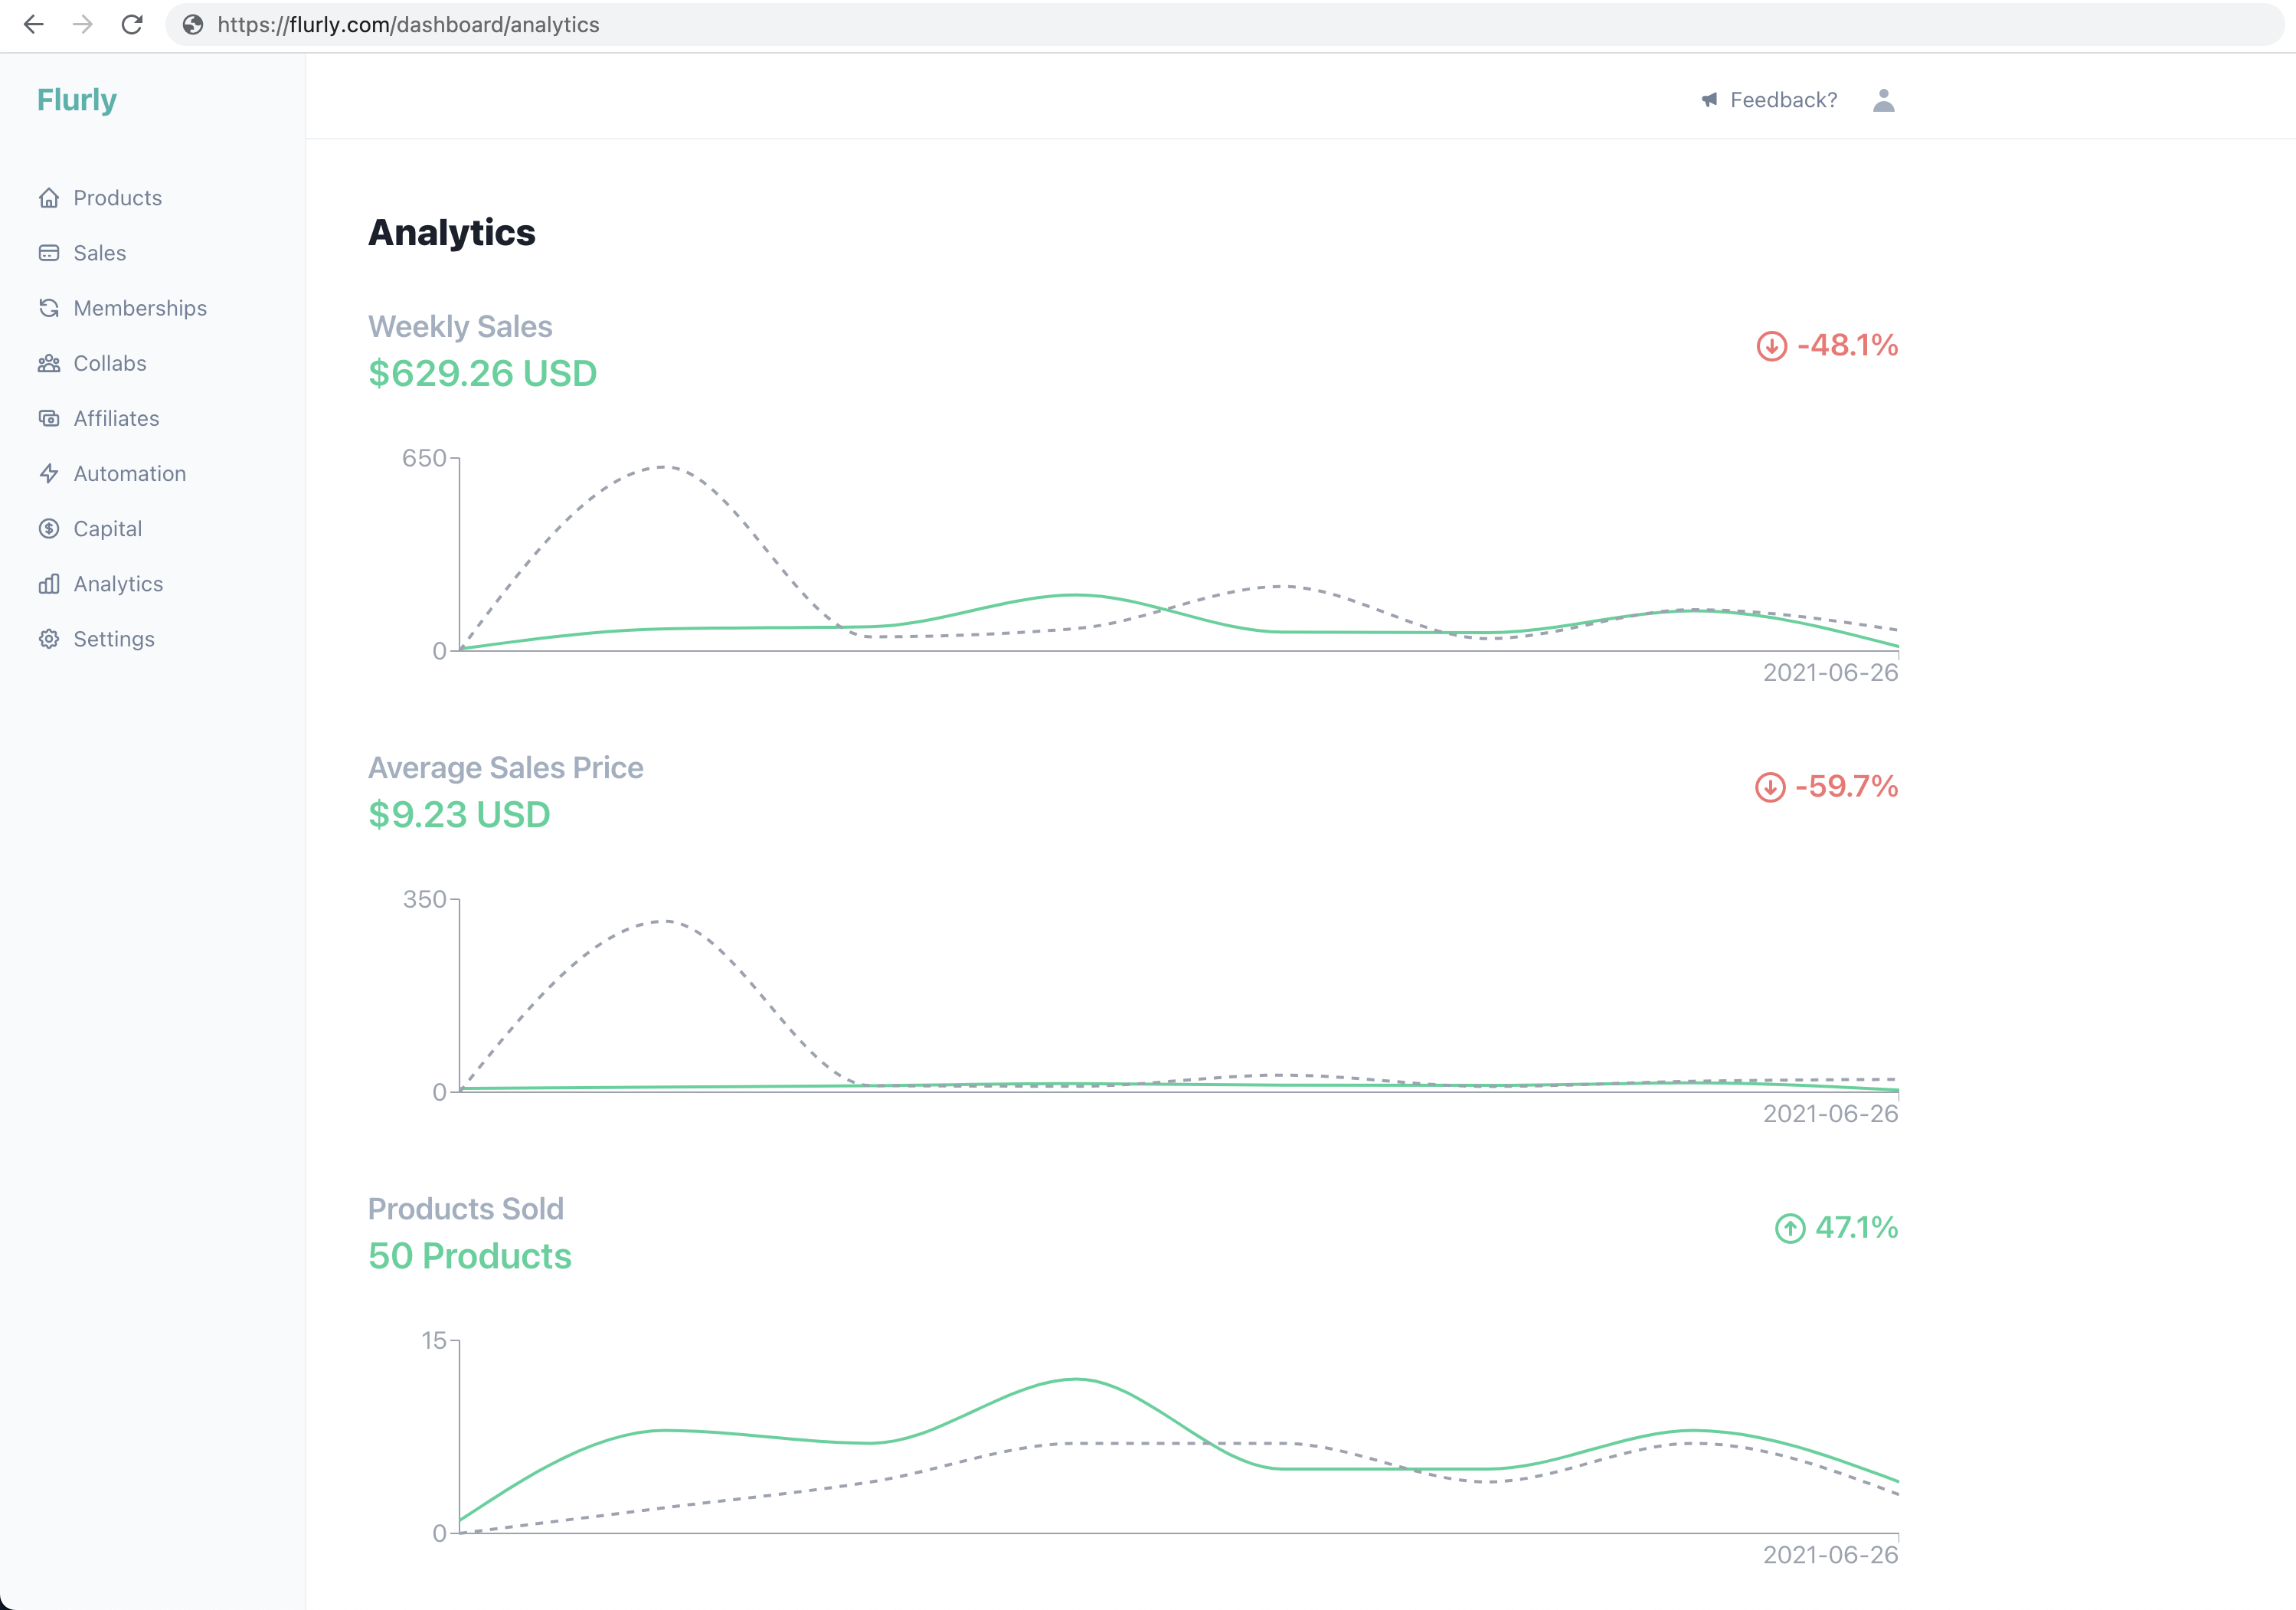
At the end of this guide, we'll have user dashboards where Flurly sellers can see
- Overall number of sales over the past week
- Overall revenue over the past week
- Average sale price over the past week
Logging the data
The first step towards accomplishing our goal is to log the data we need to generate the graphs. In particular, we need to log every time someone buys something on Flurly.
Before we get started logging each of these events, let's create a logging module so we can have cleaner code when logging. The module I create looks as follows
export function log(json) {
  const payload = {
    api_key: process.env.api_key,
    timestamp: Math.floor(new Date().getTime() / 1000),
    json: JSON.stringify(json)
  };

  await fetch("https://api.graphjson.com/api/log", {
    method: "POST",
    headers: { "Content-Type": "application/json" },
    body: JSON.stringify(payload)
  });
}
Now to finish logging, we simply insert the following code where purchases happen, in this case the Stripe Webhook
import { log } from "@/lib/log";

export function handleStripeWebHook(product) {
  // handle other purchase related things, eg. sending customer emails

  log({
    Event: "Product_Buy",
    amount: product.price,
    uid: product.uid
  });
}
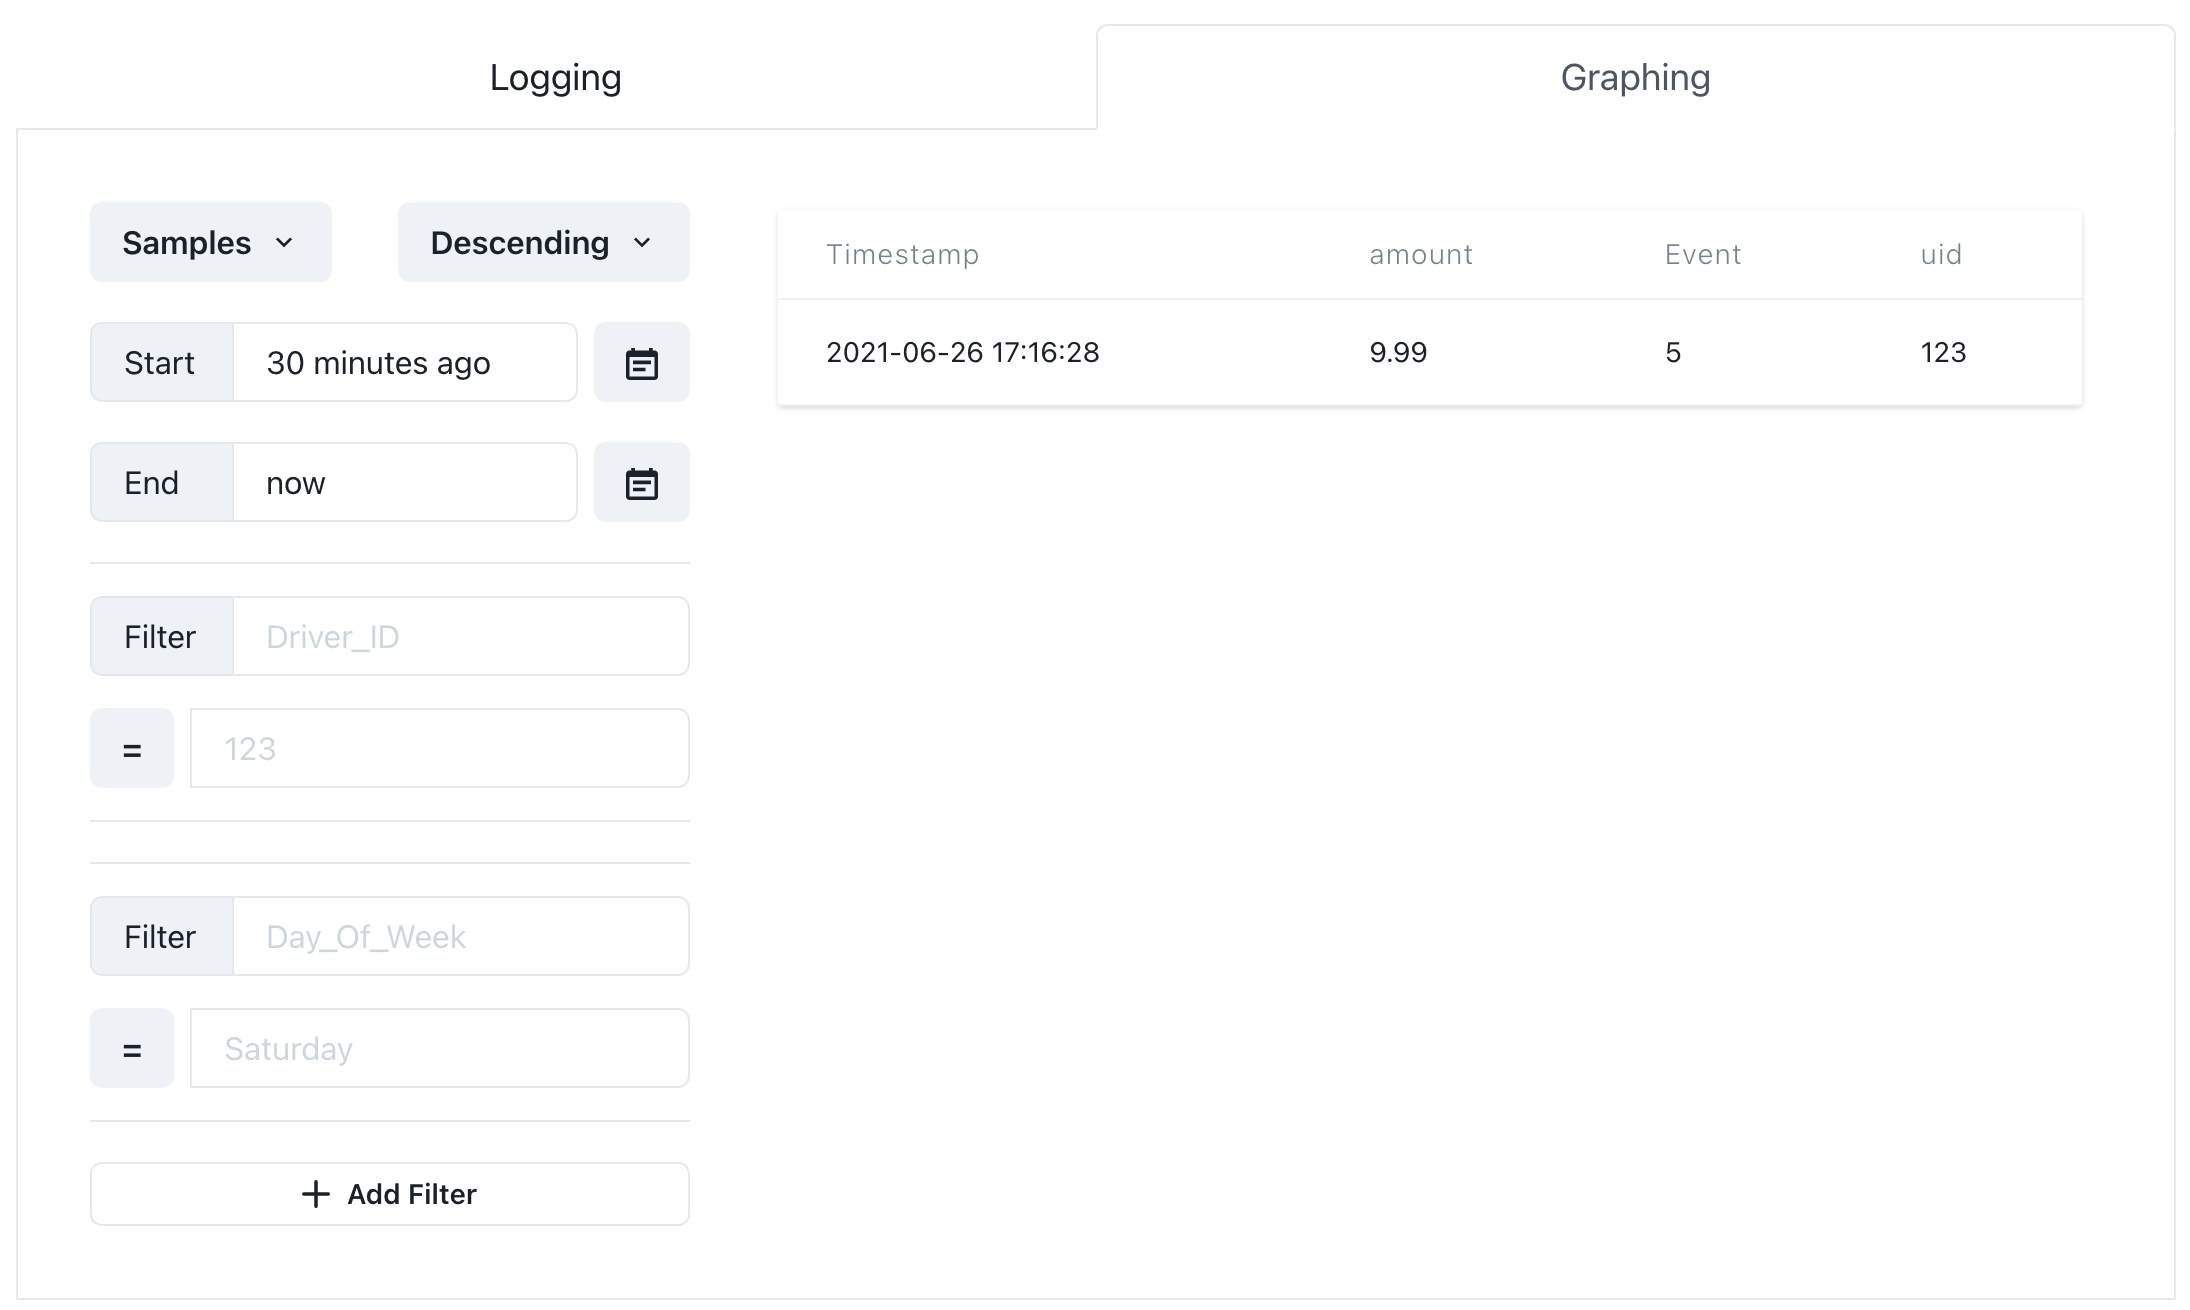
After doing a test purchase I can go to GraphJSON and look at the sample view. We can see below that the test purchase has successfully been logged.
Graphing the data
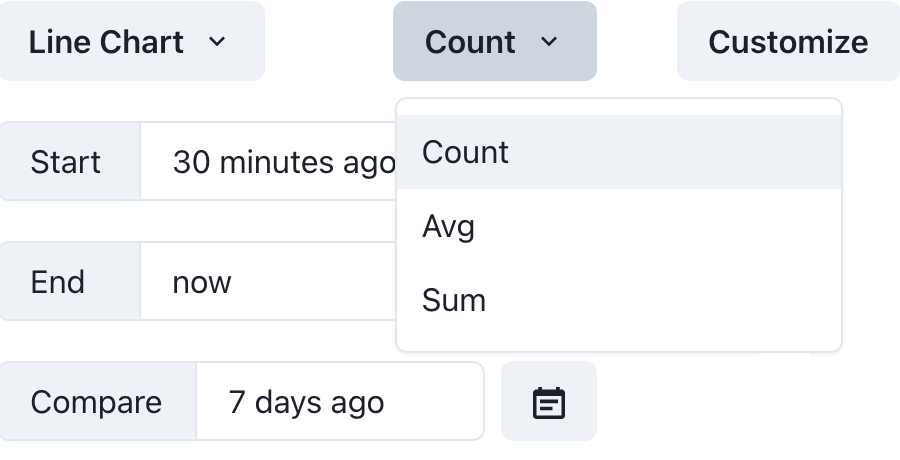
Conveniently, GraphJSON supports count, sum, and avg aggregations. These map 1-1 with the three goals we have.
- Count of purchases shows number of sales
- Sum of purchase amounts is the overall revenue
- Avg of purchase amounts is the average sale price
So here is the interesting part. We want to generate a unique graph for every flurly seller, however, in the UI we can only have one set of filters.
This is where the API comes in. What we'll do is change the uid (user id) filter based on what user we are rendering the graphs for!
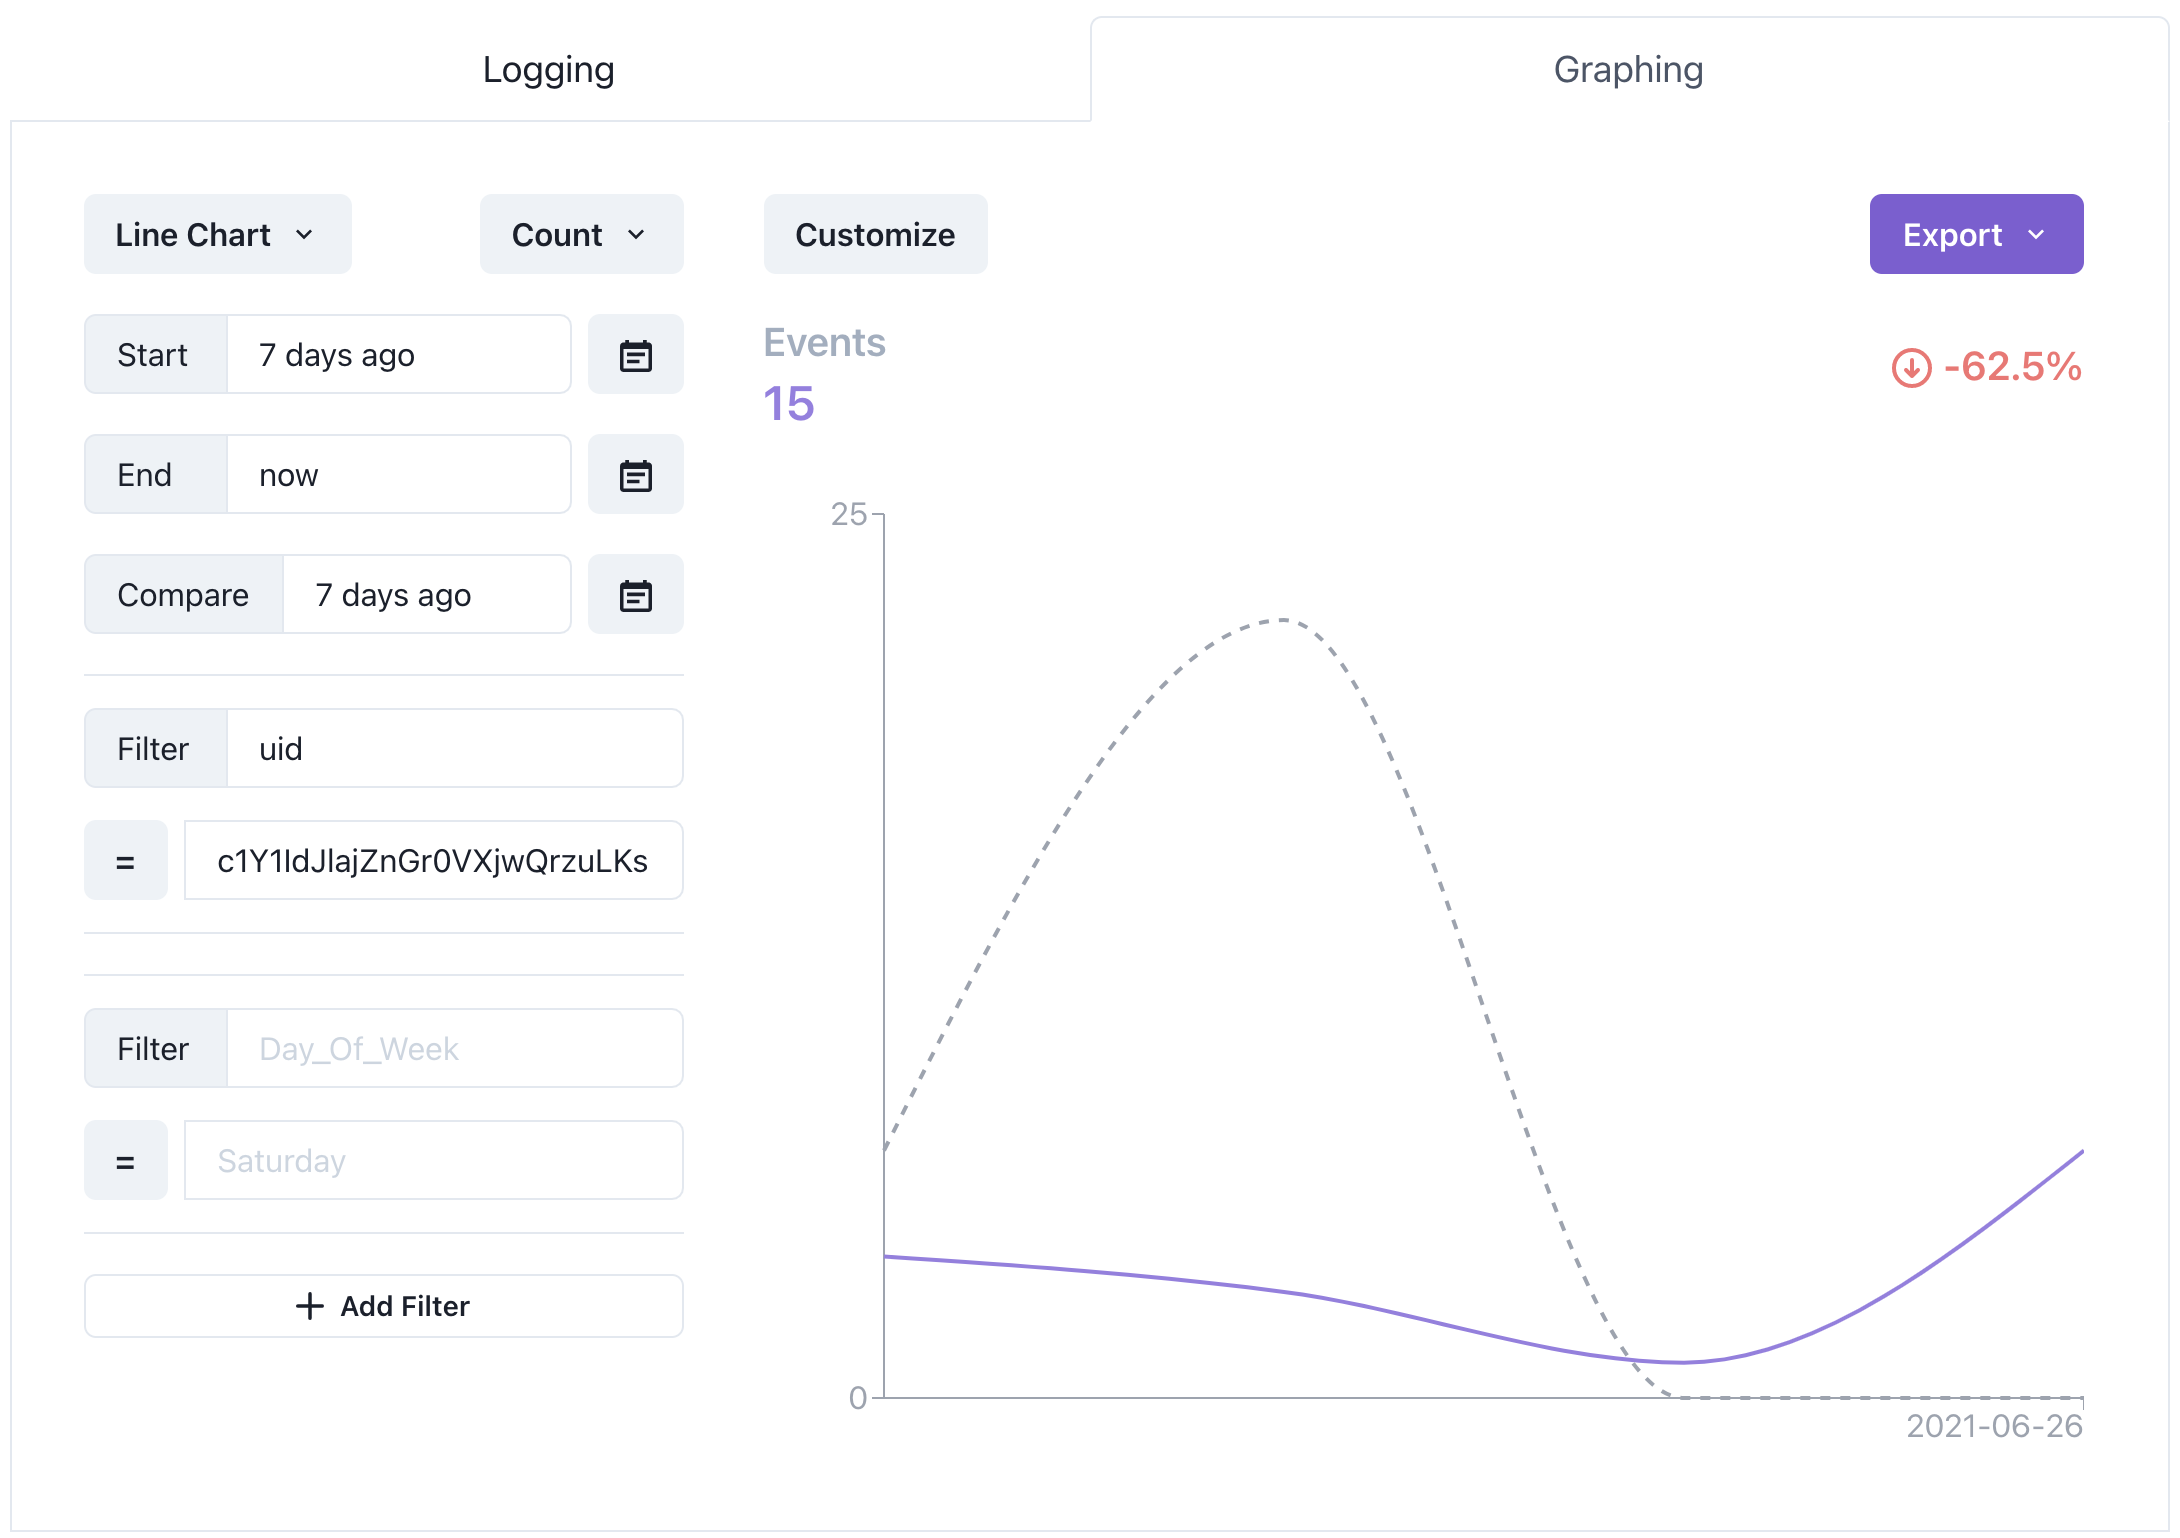
To set this up, let's create a graph for a single user. We can do this by adding a uid filter.
Embedding the graphs
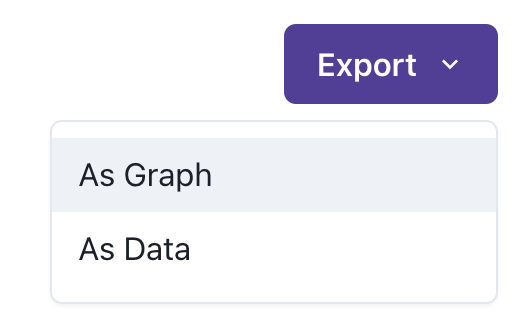
Now let's click the Export button and click on "As Graph" in the dropdown.
Notice how in the code to generate the embeds, the uid filter is parameterized. We can leverage this to make custom user dashboards.
const payload = {
  // ... other parameters
  filters: [["uid","=","c1Y1IdJlajZnGr0VXjwQrzuLKsz2"]],
};
All we need to do is change this parameter based on which user dashboard we want to load. In particular, we can use uid stored in a user's cookies as the value for this filter.
const payload = {
  // ... other parameters
  filters: [["uid","=", cookies().get('uid')]],
};
And that's it. We simply use the rest of the boilerplate code to generate an iframe and pass that down to the client. You can find the final product below
This concludes this guide. Follow me on Twitter at @TheBuilderJR and the official GraphJSON account @GraphJSON to get future project updates!